Test Your Trading Edge Like a Quant
Tradovera helps you journal trades, measure execution quality, test model confluences, and discover what actually drives your P&L.
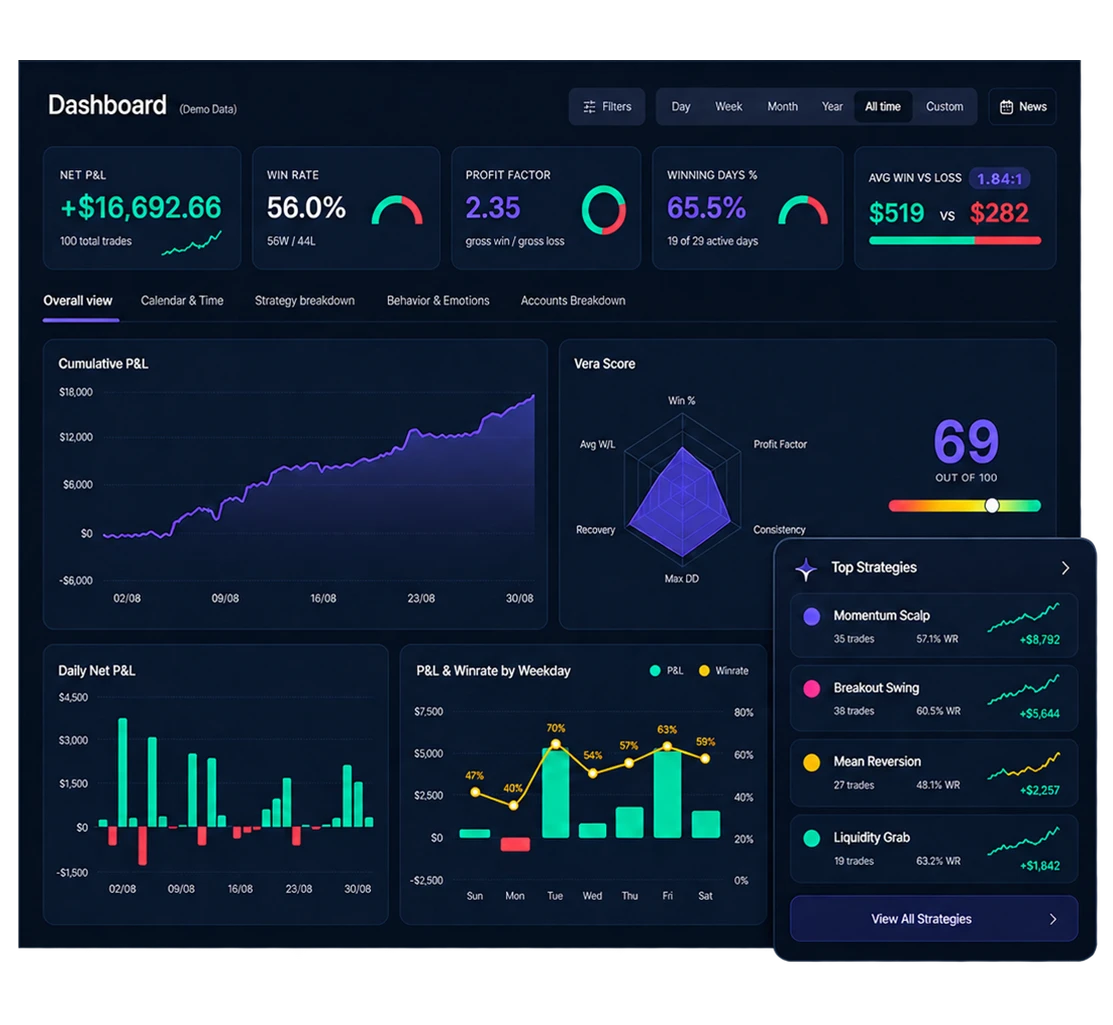
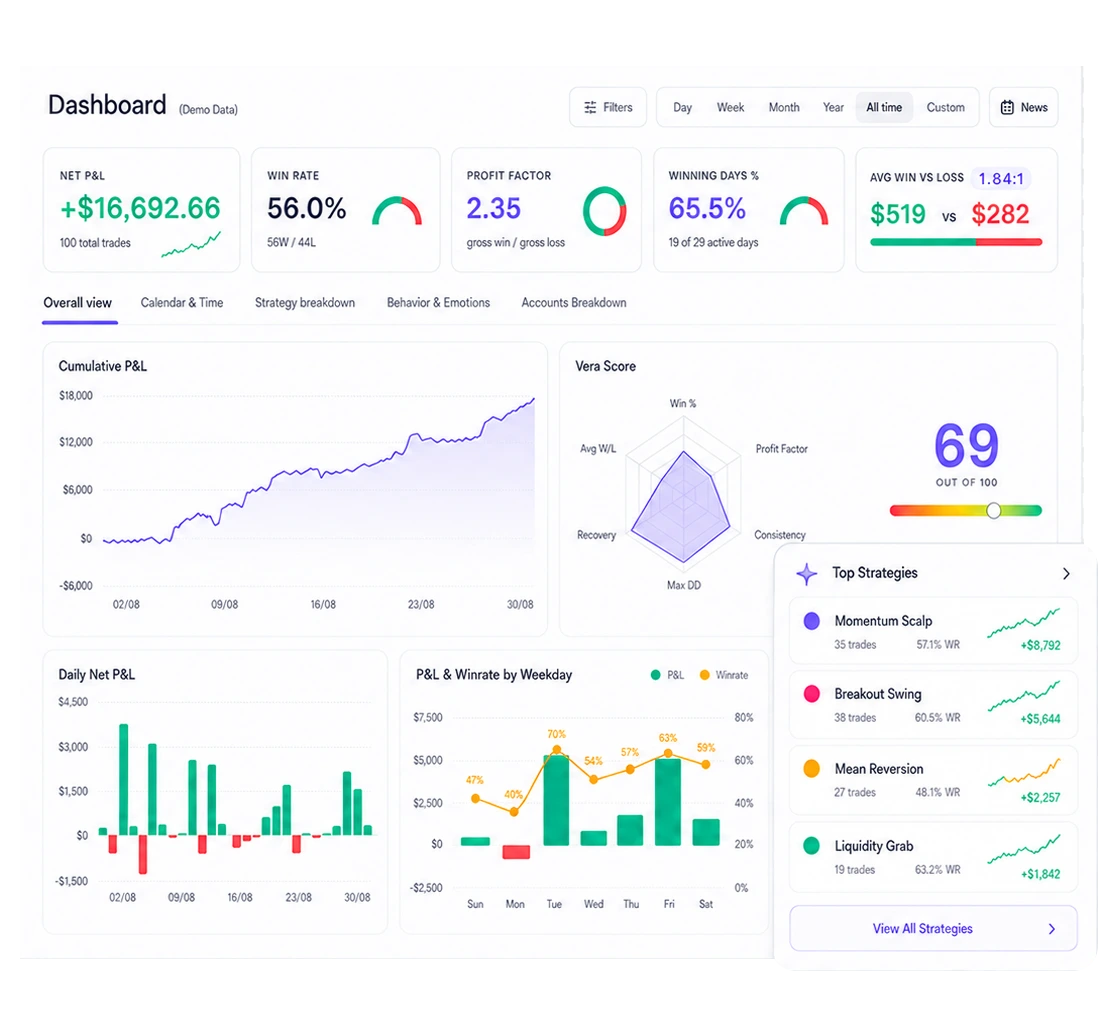





tradovera doesn't just record what happened.
It helps explain why it happened.
Every data point in tradovera connects to every other. Your trades link to your models, your models link to confluences, your confluences link to behavior and timing.
Find the confluences that actually create your edge.
Your strategy's checklist rules become testable confluences. Select any combination and run the test — tradovera shows exactly which conditions produce edge and which are noise.
confluence
performance
| Confluence | Performance Bar | Trades | Win Rate | Net P&L | Edge |
|---|---|---|---|---|---|
| Asia High/Low Liquidity Sweep | 20 | 85% | +$11,400 | A | |
| Fair Value Gap (FVG) | 18 | 78% | +$9,200 | A | |
| 5-minute timeframe entry | 25 | 72% | +$7,800 | A | |
| 1-minute timeframe entry | 22 | 68% | +$5,600 | B | |
| Wick stop loss | 23 | 61% | +$3,200 | B | |
| Body stop loss | 21 | 38% | −$2,800 | D |
Stop guessing which setups deserve capital. Test them.
Define your trading models with step-by-step execution checklists, then measure performance across every confluence and condition. Evidence over intuition.
Excel sheets don't build better traders.
Logging rows of numbers is admin work. It doesn't validate setups,
reveal behavior, or give you a clear view of performance.


Make psychology measurable.
Every trader knows psychology matters. Almost none quantify it. Tradovera turns your emotional state into a data dimension — giving you hard numbers you can actually act on.
Know when your edge is strongest — and when to stop.
Time is a hidden variable in every trade. Tradovera maps your P&L across hours, days, and weeks so you know exactly when your setups perform and when they don't.
Every trade, enriched with context
Review your trades in Card View — see the chart, side, strategy tag, and P&L at a glance. Switch to List or Calendar anytime.
See your trading performance like a quant — not a spreadsheet.
Vera Score combines win rate, profit factor, consistency, recovery, average win, and max drawdown into one benchmark — so you know where your edge is strong, weak, or improving.
Factor
Drawdown
Multi-account Tracking
Manage broker, prop firm, and personal accounts side by side. Track each account separately, compare performance, and see your combined equity curve across multiple servers.
Built by quants.
Shaped by traders.
Tradovera combines quant-level analysis with real trading workflows — because better traders need more than a journal. They need evidence, structure, and feedback.
The quant makes it rigorous
Statistical validation, confluence testing, Monte Carlo simulation, and structured evidence.
The trader makes it practical
Execution checklists, emotional state tagging, screenshots, and review loops built around real trading behavior.
Simple, transparent pricing
Choose the plan that best fits your trading journey.
- Access with sample mock data
- Explore the analytics dashboard
- Test key features
- Trade Journal, Calendar, Vera Score & Behavior
- No broker connection required
- No credit card required
- Unlimited Trades
- Full analytics dashboard
- Unlimited accounts — brokers and prop firms
- Strategy breakdown + Models
- Confluence Lab — strategy tester
- Behaviors & Emotions tracking
- Trade screenshots & notes
- Simulation & scenario testing
- All Pro features
- AI trade reviews
- AI Backtesting
- Advanced AI features
- Strategy Coding
- Priority support
- Early features access
Common questions
Stop Guessing.
Start Validating Your Edge.
Join discretionary traders who use tradovera to prove their edge with data — not vibes.
Risk Disclosures
Futures Risk Disclosure: Futures and forex trading contains substantial risk and is not for every investor. An investor could potentially lose all or more than the initial investment. Risk capital is money that can be lost without jeopardizing ones’ financial security or life style. Only risk capital should be used for trading and only those with sufficient risk capital should consider trading. Past performance is not necessarily indicative of future results.
CFTC Hypothetical Performance Disclosure: Hypothetical or simulated performance results have certain limitations. Unlike an actual performance record, simulated results do not represent actual trading. Also, since the trades have not actually been executed, the results may have under-or-over compensated for the impact, if any, of certain market factors, such as lack of liquidity. Simulated trading programs in general are also subject to the fact that they are designed with the benefit of hindsight. No representation is being made that any account will or is likely to achieve profit or losses similar to those shown.


The NinjaTrader Ecosystem and Kinetick logos are trademarks of their respective owners.